Description:
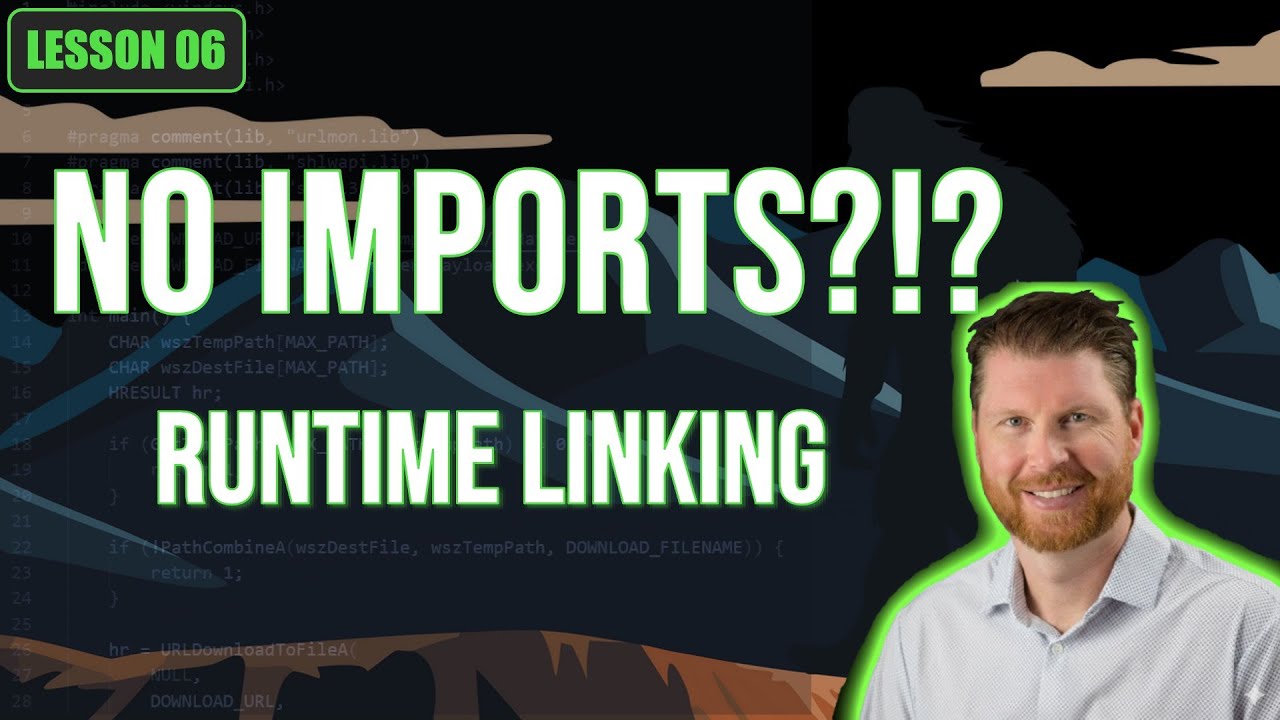
Advanced triage often starts in Procmon, not a debugger. In this walkthrough, I show you how to use the stack traces in Procmon events to dig deeper into understanding event context.
We'll also discuss how to leverage virtual addresses in a Procmon stack trace to locate the origin of an event within the binary itself. We'll explore how to track DLL dependencies and distinguish between the sample's core functionality and its external imports.
In this video:
- Beyond Filtering: Why the Stack Trace is the most underrated feature in Procmon.
- Context is King: Moving from "What happened" to "Who called it."
- VA Mapping: Taking a Virtual Address from Procmon back to your static analysis tool like IDA Pro or Ghidra
- Dependency Triage: Isolating malicious logic from noisy library code.
Join this channel to get access to perks:
https://www.youtube.com/channel/UCI8zwug_Lv4_-KPT62oeDUA/join
Cybersecurity, reverse engineering, malware analysis and ethical hacking content!
???? Courses on Pluralsight ???????? https://www.pluralsight.com/authors/josh-stroschein
????️ YouTube ???????? Like, Comment & Subscribe!
???????? Support my work ???????? https://patreon.com/JoshStroschein
???? Follow me ???????? https://twitter.com/jstrosch, https://www.linkedin.com/in/joshstroschein/
⚙️ Tinker with me on Github ???????? https://github.com/jstrosch
???? Join the Discord community and more ???????? https://www.thecyberyeti.com


Share this link via
Or copy link